
Survey Designer
Vill du snabbt ta fram en lämplig och tidseffektiv design för inventering av ett område? Ladda ner den i din GPS, iPad eller handdator för att kunna följa transekter i fält och samla in data? Det och mer kan du göra med Survey Designer.
I Survey Designer avgränsar du ditt inventeringsområde på en interaktiv karta och väljer önskade alternativ för dina transekter, bland annat optimering av tidsåtgången. Sedan skapas en design med de segment du ska inventera utlagda på kartan. Positionerna för segmenten kan du sedan ladda ner till din GPS eller handdator för att orientera efter i fält. Du kan också skapa de inmatningsfält du själv önskar, kopplat till varje segment.
Lite mer om verktyget
Hur mycket tid lägger du på förberedelser inför inventeringar? Säkert mer än du önskar, och kanske får du ändå inte det stöd du behöver när du väl kommer ut i fält… Det interaktiva verktyget Survey Designer låter dig skapa GIS-filer som visar exakt var du ska lägga ut provytor och transekter i fält. Genom att välja ett standardiserad slumpat urval kan du styra med vilken noggrannhet och tidsåtgång du vill utföra inventeringen (utifrån Ruete m.fl, in prep), du bestämmer bara hur många segment som ska ingå eller hur lång tid det får ta och verktyget skapar en lämplig design.
Survey Designer förenklar och standardiserar inventering genom att skapa GIS-filer (.shp och .gpx) redo för inmatning i GPS eller handdator, baserat på den framtagna designen. Lägg till fält för de variabler du behöver samla in eller välj från en lista med förbestämda variabler. I beta-versionen av appen ingår ett protokoll från Naturvårdsverket (Anon, 1999) som är framtaget för inventering av död ved och signalarter knutna till denna i skogsmark, inom bestånd på 1-30 ha.
Naturvårdsverkets inventeringsprotokoll baseras på ett rutnät som täcker inventeringsområdet där avståndet mellan transekter som ska provtas är proportionellt med den totala ytan på områden. Transekter läggs parallellt längs med den längsta sidan av området och delas upp i del-sträckor (segment). Inom dessa segment samlas det mesta av datat in, ytterligare data samlas in cirkelprovytor. För mer detaljer kring inventeringarna lär Read Me and Tutorial när du öppnat verktyget.
Survey Designer
This interactive application creates GIS files to facilitate the standardized survey of (mainly forest) areas. The sampling protocol is based on the protocol created by the Swedish Environmental Protection Agency (Naturvårdsverket, [1], and more details in [2]) to survey wood substrates and wood-dwelling species in forest patches of sizes ranging 1 to 30 ha.
The basis of this protocol is to delineate a square-grid over the study area with distances between transects (DT) proportional to the total forest area (A) expressed in m2 ![]() .
.
Linear transects are set along the longest side of the study area (NS or EW), and divided into sampling sub-units, segments.
If the DT is longer than 6 segments (case A) 6 segments (i.e. 3 + 3) around each intersection point are sampled, else, every other segment is sampled (case B).
 Circular sample plots are placed at the centre points of every other grid intersection for a more detailed data than in the segments.
In the original protocol segments are set every 10 m, sampling 7 m to each side, and circular plots have 7 m radius. However, note that only the segment center line and circular plot center are shown and downloaded, as only these are needed in the field.
If you want to invest less time in sampling, Survey Designer can optimize the sampling while minimizing the time in field. The method is based on a random sub-sample of the total number of segments according to [3].
TO USE THIS APPLICATION, DO LIKE THIS:
- Zoom the map to the area you are going to perform your survey in.
- Draw a polygon using any of the shape-buttons
 on the top-left (free polygon or rectangle)
 - Choose the length of the segments (i.e. the sub-unit of each transect) on the control panel to the right. The first intersection point (i.e. initial point) will placed within a random distance DEfrom the edge of the bounding box. DE is a random fraction of DT (i.e.DE = DT / rnd(0,1)). You can reduce this uncertainty by decreasing the maximum the random fraction to 0.

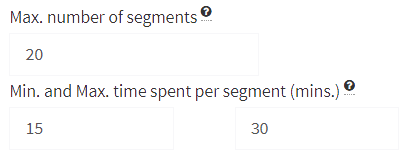
- Set the maximum number of segments you would like to sample out of the complete protocol (“Max. number of segments”), and the time range you estimate each segment can take (“Min. and Max. time spent per segment”).
- Click the “Go” button
 .
. - Don’t you like the outcome? Change the options and click “Go” again. Even if you don’t change the settings, the random distance DE will be redrawn every time you click “Go”.
- Do you like the layout? Click the “Sample” button
 to randomly sub-sample the number of segments to survey. A new selection will appear every time you click the button.
 - You can always start over by clicking on “Clear”
 .
. - Finally, you can download the layers (.SHP file) by clicking “Download” button
 on the “Download” tab. So long, there are only a few Coordinate Reference Systems to choose from, but more are coming on demand. Files will be compressed in a .TAR file (for compatibility across platforms) in your default Download folder. You can open the file with 7zip.
Author: Alejandro Ruete PhD, 2017
Greensway AB. Uppsala, Sweden.
E-mail: analys@greensway.se
[1] Anon. 1999. Fältinstruktion för undersökningstyperna: Allmäninventering, Substratinventering, Indikatorartinventering och Bestånd- och ståndortsinventering inom delprogrammet Extensiv övervakning av skogsbiotopers innehåll med inriktning mot biologisk mångfald. Naturvårdsverket. Stockholm, Sweden. 57pp. Link (as of 11/2017). [2] Jönsson, M.T., Ruete, A., Kellner, O., Gunnarsson, U., Snäll, T., 2017. Will forest conservation areas protect functionally important diversity of fungi and lichens over time? Biodivers Conserv 26, 2547–2567. doi:10.1007/s10531-015-1035-0 [3] Ruete, A., Widenfalk, O., Widenfalk, L.A., in prep. How many more? Linear transect sampling efficiency for characterization of boreal forest stands.


